Market Outlook
February 23, 2018
Market Cues
Domestic Indices
Chg (%)
(Pts)
(Close)
Indian markets are likely to open flat tracking global indices and SGX Nifty.
BSE Sensex
(0.1)
(25)
33,820
US stocks turned mixed in afternoon during the last trading session. While the Dow
Nifty
(0.1)
(15)
10,383
and the S&P 500 managed to end the day in positive territory, the tech-heavy
Mid Cap
(0.5)
(89)
16,322
Nasdaq edged modestly lower. The Dow Jones ended on an upside front of 0.7% to
Small Cap
(0.4)
(76)
17,724
close at 24,962 and the Nasdaq Composite edged down to 0.1%, to 7,210.
Bankex
0.1
37
28,179
U.K. shares fell during the last trading session as the latest Federal Reserve meeting
minutes rekindled fears of inflation and higher interest rates and a government
Global Indices
Chg (%)
(Pts)
(Close)
report showed the U.K. economy expanded by 0.4 percent in the fourth quarter,
Dow Jones
0.7
165
24,962
down from the 0.5 percent preliminary estimate released last month. The FTSE 100
Nasdaq
(0.1)
(8)
7,210
was ended on a downside front of 0.4% at 7,252.
FTSE
(0.4)
(29)
7,252
On domestic front, Indian shares closed marginally lower as the latest Federal
Nikkei
0.4
78
21,814
Reserve meeting minutes rekindled fears of inflation and higher interest rates and
Hang Seng
1.1
343
31,309
the minutes of the RBI's latest policy meeting showed increased concern among
Shanghai Com
0.7
23
3,291
members on inflationary risks. The Sensex ended on a downside front of 0.1% at
33,820 while the Nifty ended at 10,383 with a downside of 0.1%.
Advances / Declines
BSE
NSE
News Analysis
Advances
1,019
577
UP Investors' Summit: Jio to invest Rs 100bn in 3 yrs, create 100,000 jobs
Declines
1,725
1,184
Detailed analysis on Pg2
Unchanged
160
77
Investor’s Ready Reckoner
Volumes (` Cr)
Key Domestic & Global Indicators
BSE
3,473
Stock Watch: Latest investment recommendations on 150+ stocks
NSE
37,006
Refer Pg5 onwards
Top Picks
Net Inflows (` Cr)
Net
Mtd
Ytd
CMP
Target
Upside
Company
Sector
Rating
FII
(1,221)
(7,371)
5,613
(`)
(`)
(%)
Blue Star
Capital Goods
Buy
730
867
18.8
*MFs
1,080
8,135
17,158
Dewan Housing Finance
Financials
Buy
551
712
29.2
Century Plyboards
Forest Products
Buy
317
400
26.4
Top Gainers
Price (`)
Chg (%)
Navkar Corporation
Other
Buy
164
265
61.4
Biocon
617
6.1
KEI Industries
Capital Goods
Buy
366
436
19.2
Rnaval
41
5.7
More Top Picks on Pg4
Kwality
87
5.6
Key Upcoming Events
Idbi
74
5.2
Previous
Consensus
Date
Region
Event Description
Reading
Expectations
Kprmill
724
4.4
Feb23
Euro Zone Euro-Zone CPI (YoY)
1.30
1.30
Feb23
Germany GDP nsa (YoY)
2.30
2.30
Top Losers
Price (`)
Chg (%)
Feb26
US
New home sales
625.00
646.50
Fortis
146
(6.0)
Feb27
Germany Unemployment change (000's)
(24.00)
Vakrangee
200
(5.0)
Feb27
Euro Zone Euro-Zone Consumer Confidence
0.10
More Events on Pg7
Videoind
17
(4.9)
Religare
54
(4.7)
Pcjeweller
331
(4.6)
As on February 22 2018
Market Outlook
February 23, 2018
News Analysis
UP Investors' Summit: Jio to invest Rs 100bn in 3 yrs, create 100,000
jobs
Reliance Industries Chairman and Managing Director Mukesh Ambani committed
to investing Rs. 100 billion in Uttar Pradesh over the next three years. "Jio has
invested Rs. 200 billion already in the state, and plans to invest another Rs. 100
billion over the next three years”.
Furthermore, the top businessman stated that over 20 million Jio phones will be
sanctioned and 100,000 new jobs would be created in Uttar Pradesh. Apart from
that RIL has rebuilt the next generation digital communication services to help
hospitals, schools, small, medium businesses o grow.
Economic and Political News
I-T dept attaches Rs 12bn SEZ unit of Gitanjali Gems in Hyderabad
Govt ropes in Nandan Nilekani for developing IT infra for healthcare
scheme
Malaysia's Petronas signs first term agreement for LNG supply in India
Corporate News
RInfra bags Rs 36.4 billion contract for thermal power plant in Tamil Nadu
Rolls Royce unveils 'costliest car in India' Phantom for Rs 95 million
Fortis' Malvinder & Shivinder Singh say they are not going anywhere
Market Outlook
February 23, 2018
Top Picks
Market Cap
CMP
Target
Upside
Company
Rationale
(` Cr)
(`)
(`)
(%)
Strong growth in domestic business due to its leade`hip
in acute therapeutic segment. Alkem expects to launch
Alkem Laboratories
26,017
2,176
2,441
12.2
more products in USA, which bodes for its international
business.
Favorable outlook for the AC industry to augur well for
Cooling products business which is out pacing the
Blue Star
7,003
730
867
18.8
market growth. EMPPAC division's profitability to
improve once operating environment turns around.
With a focus on the low and medium income (LMI)
consumer segment, the company has increased its
Dewan Housing Finance
17,284
551
712
29.2
presence in tier-II & III cities where the growth
opportunity is immense.
Loan growth is likely to pick up after a sluggish FY17.
Lower credit cost will help in strong bottom-line growth.
Karur Vysya Bank
7,922
109
160
46.7
Increasing share of CASA will help in NIM
improvement.
High order book execution in EPC segment, rising B2C
KEI Industries
2,865
366
436
19.2
sales and higher exports to boost the revenues and
profitability
Expected to benefit from the lower capex requirement
Music Broadcast
2,029
356
475
33.6
and 15 year long radio broadcast licensing.
Massive capacity expansion along with rail advantage
Navkar Corporation
2,471
164
265
61.4
at ICD as well CFS augur well for the company
Strong brands and distribution network would boost
Siyaram Silk Mills
3,082
658
851
29.4
growth going ahead. Stock currently trades at an
inexpensive valuation.
Market leadership in Hindi news genre and no.
2
viewership ranking in English news genre, exit from the
TV Today Network
2,721
456
508
11.4
radio business, and anticipated growth in ad spends by
corporate to benefit the stock.
After GST, the company is expected to see higher
volumes along with improving product mix. The Gujarat
Maruti Suzuki
2,61,311
8,650
10,619
22.8
plant will also enable higher operating leverage which
will be margin accretive.
We expect loan book to grow at 24.3% over next two
GIC Housing
2,118
393
655
66.5
year; change in borrowing mix will help in NIM
improvement
We expect CPIL to report net Revenue/PAT CAGR of
~17%/16% over FY2017-20E mainly due to healthy
7,032
317
400
26.4
growth in plywood & lamination business, forayed into
Century Plyboards India
MDF & Particle boards on back of strong brand &
distribution network.
We expect sales/PAT to grow at 13.5%/20% over next
LT Foods
2,935
92
128
39.5
two years on the back of strong distribution network &
addition of new products in portfolio.
We expect financialisation of savings and increasing
Aditya Birla Capital
36204
165
230
39.0
penetration in Insurance & Mutual fund would ensure
steady growth.
Third largest brand play in luggage segment Increased
product offerings and improving distribution network is
Safari Industries
1230
531
650
22.4
leading to strong growth in business. Likely to post
robust growth for next 3-4 years
We expect HSIL to report PAT CAGR of ~15% over
FY2017-20E owing to better improvement in operating
HSIL
3081
424
510
20.3
margin due price hike in container glass segment,
turnaround in consumer business.
Source: Company, Angel Research
Market Outlook
February 23, 2018
Fundamental Call
Market Cap
CMP
Target
Upside
Company
Rationale
(` Cr)
(`)
(`)
(%)
CCL is likely to maintain the strong growth trajectory
CCL Products
3,693
278
360
29.7
over FY18-20 backed by capacity expansion and new
geographical foray
We forecast Nilkamal to report top-line CAGR of ~9%
to `2,635cr over FY17-20E on the back of healthy
Nilkamal
2,537
1,700
2,178
28.1
demand growth in plastic division. On the bottom-line
front, we estimate ~10% CAGR to `162cr owing to
improvement in volumes.
We expect sales/PAT to grow at 9%/14% over next two
years on the back of healthy demand growth in
Shreyans Industries
214
155
247
59.4
printing. Further, China had banned making paper
from waste pulp which would benefit Indian paper
companies.
The prism has diversified exposure in the different
segment such as Cement, Tile & ready mix concrete.
Prism Cement
6,262
124
160
28.6
Thus we believe, PCL is in the right place to capture
ongoing government spending on affordable housing
and infrastructure projects.
Source: Company, Angel Research
Market Outlook
February 23, 2018
Key Upcoming Events
Global economic events release calendar
Bloomberg Data
Date
Time Country
Event Description
Unit
Period
Last Reported
Estimated
Feb 23, 2018
3:30 PMEuro Zone
Euro-Zone CPI (YoY)
%
Jan F
1.30
1.30
12:30 PMGermany
GDP nsa (YoY)
% Change
4Q F
2.30
2.30
Feb 26, 2018
8:30 PMUS
New home sales
Thousands
Jan
625.00
646.50
Feb 27, 2018
2:25 PMGermany
Unemployment change (000's)
Thousands
Feb
(24.00)
3:30 PMEuro Zone
Euro-Zone Consumer Confidence
Value
Feb F
0.10
Feb 28, 2018
8:30 PMUS
Consumer Confidence
S.A./ 1985=100
Feb
125.40
125.70
6:30 AMChina
PMI Manufacturing
Value
Feb
51.30
51.20
7:00 PMUS
GDP Qoq (Annualised)
% Change
4Q S
2.60
2.60
Mar 01, 2018
2:25 PMGermany
PMI Manufacturing
Value
Feb F
60.30
3:00 PMUK
PMI Manufacturing
Value
Feb
55.30
Mar 05, 2018
2:25 PMGermany
PMI Services
Value
Feb F
55.30
Mar 07, 2018
3:30 PMEuro Zone
Euro-Zone GDP s.a. (QoQ)
% Change
4Q F
0.60
Mar 08, 2018
China
Exports YoY%
% Change
Feb
11.10
6:15 PMEuro Zone
ECB announces interest rates
%
Mar 8
-
Mar 09, 2018
3:00 PMUK
Industrial Production (YoY)
% Change
Jan
-
7:00 PMUS
Change in Nonfarm payrolls
Thousands
Feb
200.00
200.00
7:00 AMChina
Consumer Price Index (YoY)
% Change
Feb
1.50
7:00 PMUS
Unnemployment rate
%
Feb
4.10
4.10
Mar 12, 2018
5:30 PMIndia
Industrial Production YoY
% Change
Jan
7.10
Mar 13, 2018
6:00 PMUS
Consumer price index (mom)
% Change
Feb
0.50
Mar 14, 2018
12:00 PMIndia
Monthly Wholesale Prices YoY%
% Change
Feb
2.84
US
Producer Price Index (mom)
% Change
Feb
0.70
Mar 15, 2018
India
Imports YoY%
% Change
Feb
26.10
India
Exports YoY%
% Change
Feb
9.10
Source: Bloomberg, Angel Research
Market Outlook
February 23, 2018
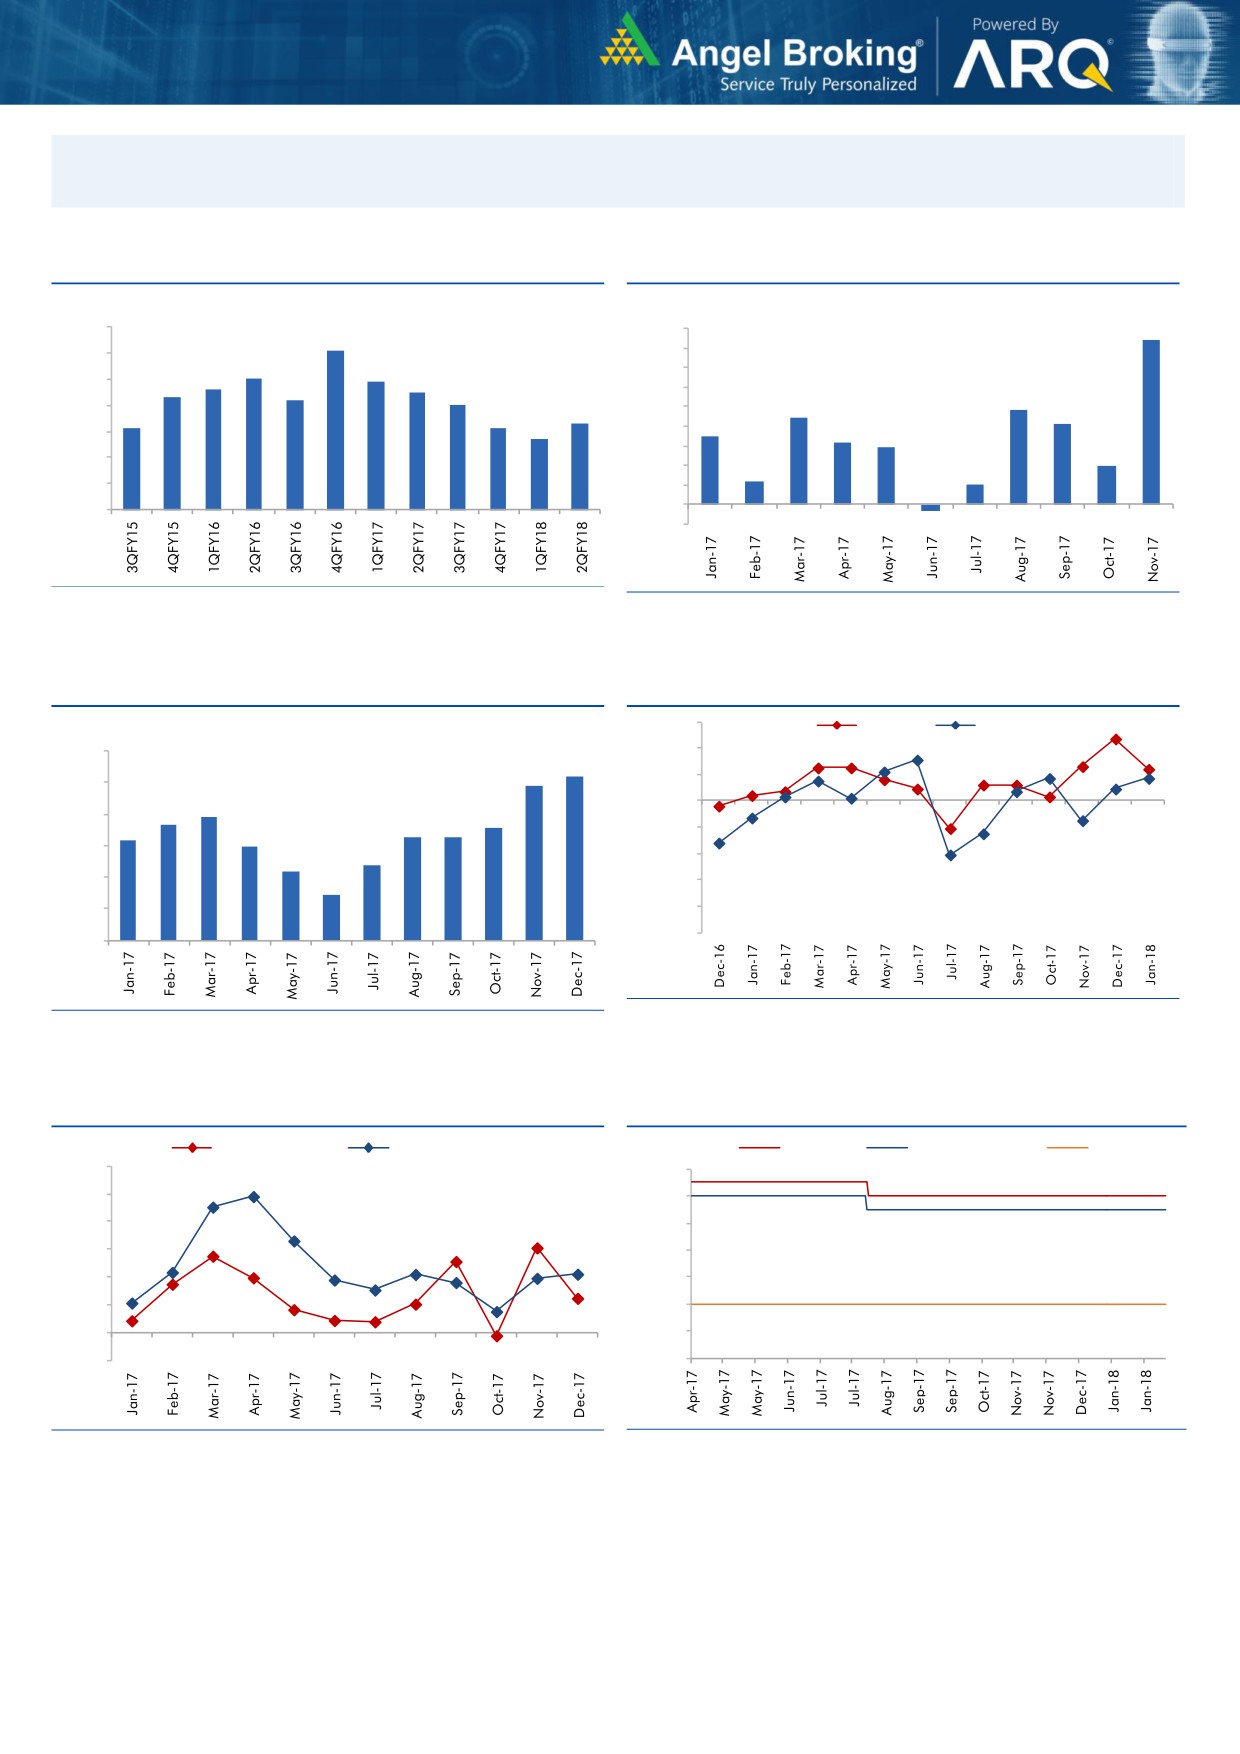
Macro watch
Exhibit 1: Quarterly GDP trends
Exhibit 2: IIP trends
(%)
(%)
10.0
9.0
8.4
9.1
9.0
8.0
8.0
7.9
7.0
7.6
7.5
8.0
7.3
7.2
7.0
6.0
4.8
7.0
6.3
5.0
4.4
4.1
6.1
6.1
5.7
3.5
3.2
6.0
4.0
2.9
3.0
2.0
5.0
2.0
1.2
1.0
4.0
1.0
-
3.0
(1.0)
(0.3)
Source: CSO, Angel Research
Source: MOSPI, Angel Research
Exhibit 3: Monthly CPI inflation trends
Exhibit 4: Manufacturing and services PMI
56.0
Mfg. PMI
Services PMI
(%)
6.0
54.0
5.2
4.9
52.0
5.0
3.9
50.0
3.7
3.6
4.0
3.3
3.3
3.2
3.0
48.0
3.0
2.4
2.2
46.0
2.0
1.5
44.0
1.0
42.0
40.0
-
Source: Market, Angel Research; Note: Level above 50 indicates expansion
Source: MOSPI, Angel Research
Exhibit 5: Exports and imports growth trends
Exhibit 6: Key policy rates
(%)
Exports yoy growth
Imports yoy growth
(%)
Repo rate
Reverse Repo rate
CRR
60.0
6.50
50.0
6.00
40.0
5.50
30.0
5.00
20.0
4.50
10.0
4.00
0.0
3.50
(10.0)
3.00
Source: Bloomberg, Angel Research
Source: RBI, Angel Research
Market Outlook
February 23, 2018
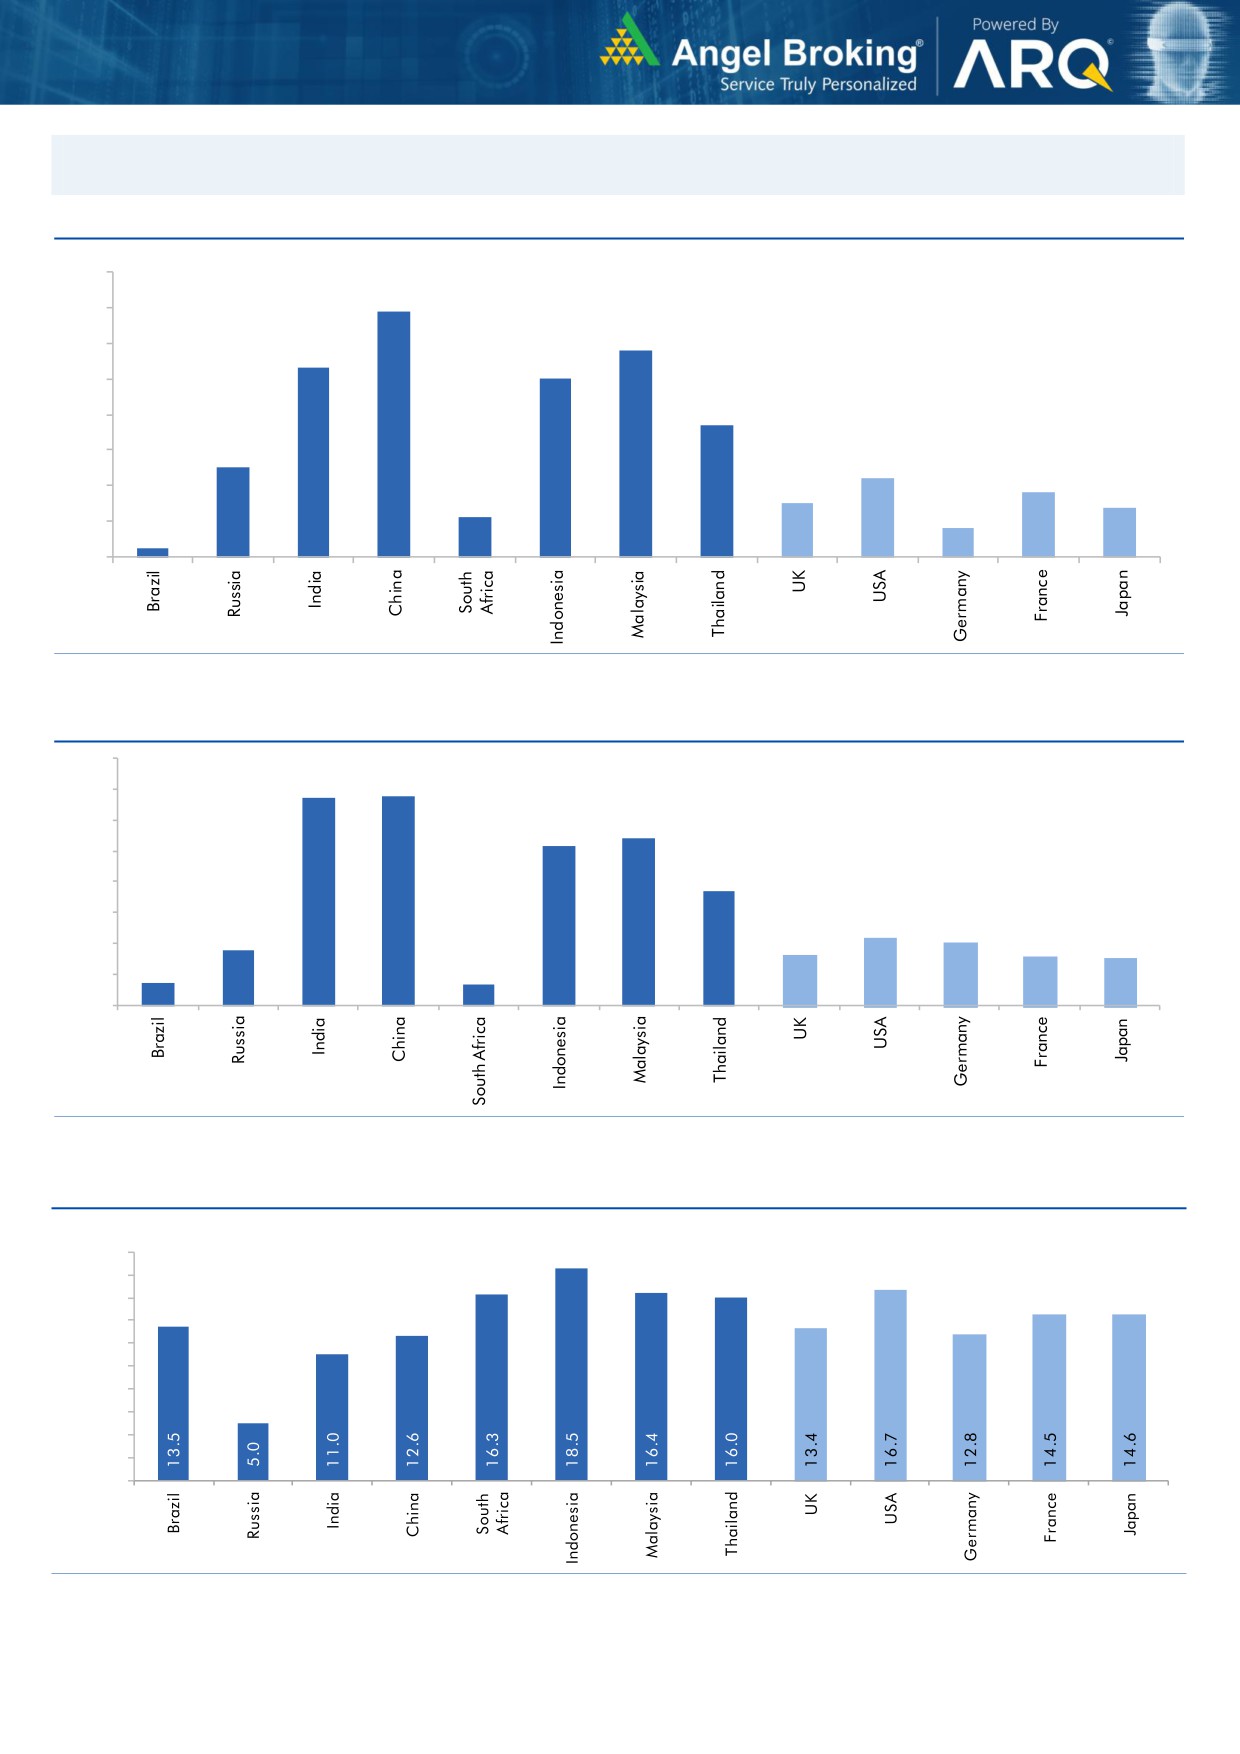
Global watch
Exhibit 1: Latest quarterly GDP Growth (%, yoy) across select developing and developed countries
(%)
8.0
6.9
7.0
5.8
6.0
5.3
5.0
5.0
1.1
3.7
4.0
2.5
3.0
2.2
1.8
2.0
1.5
1.4
0.8
1.0
0.3
-
Source: Bloomberg, Angel Research
Exhibit 2: 2017 GDP Growth projection by IMF (%, yoy) across select developing and developed countries
(%)
6.7
6.8
7.0
6.0
5.4
5.2
5.0
3.7
4.0
3.0
1.8
2.2
2.0
1.7
1.6
2.0
0.7
1.5
0.7
1.0
-
Source: IMF, Angel Research
Exhibit 3: One year forward P-E ratio across select developing and developed countries
(x)
20.0
18.0
16.0
14.0
12.0
10.0
8.0
6.0
4.0
2.0
-
Source: IMF, Angel Research
Market Outlook
February 23, 2018
Exhibit 4: Relative performance of indices across globe
Returns (%)
Country
Name of index
Closing price
1M
3M
1YR
Brazil
Bovespa
86,686
7.1
22.4
29.4
Russia
Micex
2,337
1.6
8.4
10.9
India
Nifty
10,383
(4.7)
0.5
17.7
China
Shanghai Composite
3,269
(4.4)
(2.6)
2.5
South Africa
Top 40
51,259
(6.0)
(6.9)
12.5
Mexico
Mexbol
48,970
(2.0)
2.3
3.8
Indonesia
LQ45
1,105
(1.4)
10.4
24.1
Malaysia
KLCI
1,855
1.8
8.0
8.6
Thailand
SET 50
1,171
(1.8)
7.4
19.0
USA
Dow Jones
24,962
(4.8)
6.9
20.0
UK
FTSE
7,252
(6.2)
(2.1)
0.1
Japan
Nikkei
21,736
(8.7)
(2.8)
11.8
Germany
DAX
12,462
(8.1)
(5.4)
4.3
France
CAC
5,309
(4.1)
(1.1)
9.3
Source: Bloomberg, Angel Research p68in4
Market Outlook
February 23, 2018
Research Team Tel: 022 - 39357800
DISCLAIMER
Angel Broking Private Limited (hereinafter referred to as “Angel”) is a registered Member of National Stock Exchange of India
Limited,Bombay Stock Exchange Limited and Metropolitan Stock Exchange Limited. It is also registered as a Depository Participant with
CDSL and Portfolio Manager with SEBI. It also has registration with AMFI as a Mutual Fund Distributor. Angel Broking Private Limited is a
registered entity with SEBI for Research Analyst in terms of SEBI (Research Analyst) Regulations, 2014 vide registration number
INH000000164. Angel or its associates has not been debarred/ suspended by SEBI or any other regulatory authority for accessing
/dealing in securities Market. Angel or its associates/analyst has not received any compensation / managed or
co-managed public offering of securities of the company covered by Analyst during the past twelve months.
This document is solely for the personal information of the recipient, and must not be singularly used as the basis of any investment
decision. Nothing in this document should be construed as investment or financial advice. Each recipient of this document should make
such investigations as they deem necessary to arrive at an independent evaluation of an investment in the securities of the companies
referred to in this document (including the merits and risks involved), and should consult their own advisors to determine the merits and
risks of such an investment.
Reports based on technical and derivative analysis center on studying charts of a stock's price movement, outstanding positions and
trading volume, as opposed to focusing on a company's fundamentals and, as such, may not match with a report on a company's
fundamentals. Investors are advised to refer the Fundamental and Technical Research Reports available on our website to evaluate the
contrary view, if any.
The information in this document has been printed on the basis of publicly available information, internal data and other reliable
sources believed to be true, but we do not represent that it is accurate or complete and it should not be relied on as such, as this
document is for general guidance only. Angel Broking Pvt. Limited or any of its affiliates/ group companies shall not be in any way
responsible for any loss or damage that may arise to any person from any inadvertent error in the information contained in this report.
Angel Broking Pvt. Limited has not independently verified all the information contained within this document. Accordingly, we cannot
testify, nor make any representation or warranty, express or implied, to the accuracy, contents or data contained within this document.
While Angel Broking Pvt. Limited endeavors to update on a reasonable basis the information discussed in this material, there may be
regulatory, compliance, or other reasons that prevent us from doing so.
This document is being supplied to you solely for your information, and its contents, information or data may not be reproduced,
redistributed or passed on, directly or indirectly.
Neither Angel Broking Pvt. Limited, nor its directors, employees or affiliates shall be liable for any loss or damage that may arise from
or in connection with the use of this information.